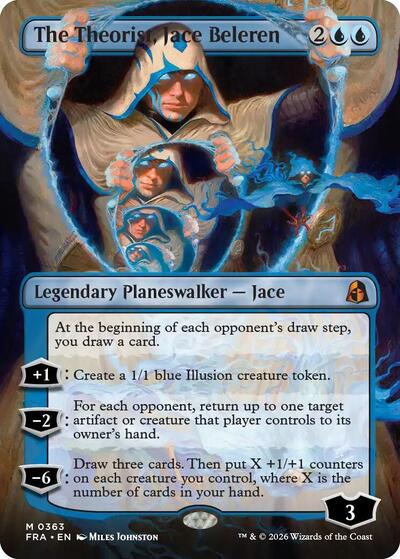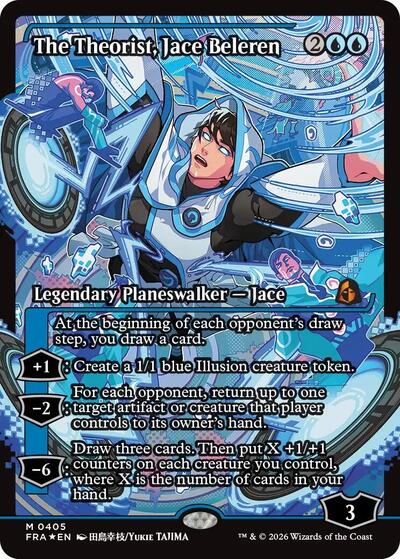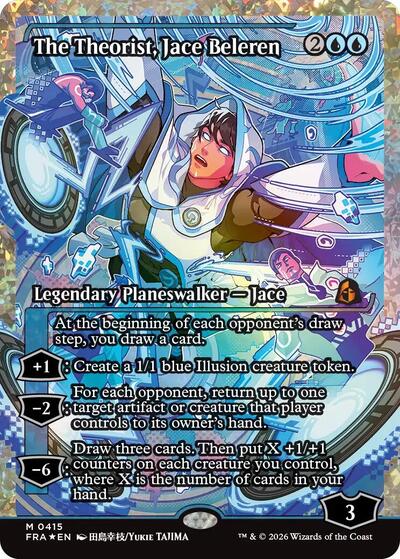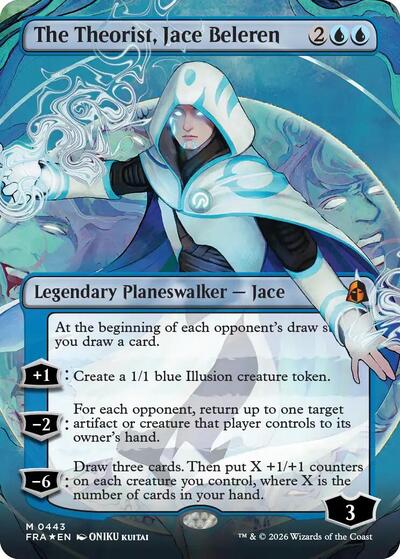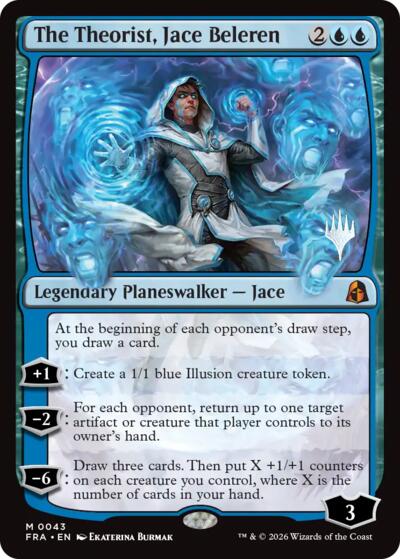


Fair value · Normal · Lightly Played
likely $31.01 – $46.62
−6.7%
past 30 days
- Liquidity
- Very liquidsells about 10 a day · last today
- Sold, 30 days
- 57
- Lowest listing
- $44.30
- Market Price
- $45.39
Outlook · 30d
Cooling off
Fair value is drifting down across recent sales.
- 7d
- −25%
- 30d
- −6.7%
- 90d
- —
Change to today's $38.03
From sales only · 57 sold, 30d
Pull odds
Open a pack- NormalRare or mythic rare card: M · Reality Fracture - Play Booster1 in 135 packs0.74%
- FoilTraditional foil rare or mythic rare card: M · Reality Fracture - Collector Booster1 in 154 packs0.65%
- FoilTraditional foil card: M · Reality Fracture - Play Booster1 in 2,167 packs0.05%
Every Normal sale we've read, grouped by when and for how much they sold, with the fair value line through them. Hover a bubble for its sales; the legend adds the other conditions.
- Fair value · LP
- $38.03
- Change · 90d
- +33%
- Sales counted
- 57~1/day
- Most LP sold for
- $45 – $64
Forecast · LP · 30 days
$42.34+11%
fair value $33.79 – $53.06 · sales likely $31 – $58
- Buying pace
- ~3/dayselling faster
- Sales read
- 148over 34 days
- Last check
- 11.1% away14-day call
Each bubble groups sales that sold close together in time and price, sized by how many; hover one for its sales. Solid counts toward fair value, hollow was left out. The line is fair value over time, from sales only, ending at today's. The strip underneath counts sales. Past today, the dashed line is the forecast: where fair value is heading from what sold and how fast it's selling. The shaded fan is how far fair value may move, 4 times in 5; it widens the further out it looks. The forecast never changes fair value. Price axis is logarithmic.
How each Normal lightly played copy sold. Times are US Central.
Very liquid
Sells about 3 a day · last sold today
Typical sale, 30 days
$55.91
Trimmed average of counted sales
Lowest listed
- $44.30
Verified sellers, no photo listings · 31 listed
Oct 28
5:03 PM
Online · Buy it now$38.89
incl. $2.99 ship
Oct 28
4:57 PM
Online · Buy it now$38.99
incl. $0.99 ship
Oct 28
3:46 PM
Online · Buy it now$41.89
incl. $3.99 ship
Oct 28
9:37 AM
Online · Buy it now×3$32.19
incl. $5.99 ship
Oct 27
10:26 PM
Online · Buy it now×3$44.25
free ship
Oct 27
1:13 PM
Online · Buy it now$44.31
free ship
Oct 27
10:35 AM
Online · Buy it now$44.00
free ship
Oct 27
10:16 AM
Online · Buy it now$45.33
incl. $0.89 ship
Oct 26
8:32 PM
Online · Buy it now$36.62
incl. $4.99 ship
Oct 26
7:10 PM
Online · Buy it now$45.88
free ship
Oct 26
6:23 PM
Online · Buy it now$39.00
free ship
Oct 26
4:46 PM
Online · Buy it now$40.74
free ship
Oct 26
11:32 AM
Online · Buy it now$42.74
incl. $1.99 ship
Oct 24
4:30 PM
Online · Buy it now×2$49.73
incl. $1.45 ship
Oct 24
8:55 AM
Online · Buy it now×2$49.00
free ship
Oct 23
1:57 PM
Online · Buy it now×4$56.45
free ship
Oct 22
7:27 PM
Online · Buy it now$46.99
incl. $0.99 ship
Oct 22
6:04 PM
Online · Buy it now$51.00
free ship
Oct 22
2:33 PM
Online · Buy it now$51.94
free ship
Oct 22
12:54 PM
Online · Buy it now$55.57
free ship
Oct 22
11:04 AM
Online · Buy it now$51.00
incl. $2.00 ship
Oct 21
7:06 PM
Online · Buy it now$54.94
incl. $0.99 ship
Oct 20
3:35 PM
Online · Buy it now$56.78
incl. $3.79 ship
Oct 20
12:41 PM
Online · Buy it now$49.99
free ship
Oct 20
12:06 PM
Online · Buy it now$49.99
free ship
Oct 20
10:48 AM
Online · Buy it now$49.99
incl. $0.99 ship
Oct 20
10:42 AM
Online · Buy it now$52.49
free ship
Oct 19
1:49 PM
Online · Buy it now$57.99
free ship
Oct 19
10:42 AM
Online · Buy it now×3$63.62
incl. $1.22 ship
Oct 19
8:49 AM
Online · Buy it now$63.66
free ship
Oct 18
12:51 PM
Online · Buy it now$63.66
free ship
Oct 17
8:56 PM
Online · Buy it now$63.31
free ship
Oct 17
7:49 PM
Online · Buy it now$63.70
incl. $3.00 ship
Oct 17
6:44 PM
Online · Buy it now$76.64
incl. $12.00 ship
Oct 17
5:01 PM
Online · Buy it now$63.39
free ship
Oct 17
9:39 AM
Online · Buy it now$65.71
incl. $1.50 ship
Oct 17
8:01 AM
Online · Buy it now$63.57
free ship
Oct 17
12:24 AM
Online · Buy it now×2$63.57
free ship
Oct 16
5:53 PM
Online · Buy it now$61.30
incl. $1.30 ship
Oct 16
3:06 PM
Online · Buy it now$54.29
incl. $5.99 ship
Oct 16
1:24 PM
Online · Buy it now$62.99
incl. $0.99 ship
Oct 16
12:16 PM
Online · Buy it now$64.91
free ship
Oct 15
10:27 PM
Online · Buy it now$63.03
free ship
Oct 15
10:06 PM
Online · Buy it now$74.15
incl. $9.00 ship
Oct 15
10:06 PM
Online · Buy it now$68.01
incl. $4.99 ship
Oct 15
6:59 PM
Online · Buy it now$63.03
free ship
Oct 15
6:59 PM
Online · Buy it now×2$60.50
incl. $0.99 ship
Oct 15
12:58 AM
Online · Buy it now$59.28
incl. $1.49 ship
Oct 14
10:40 PM
Online · Buy it now$64.30
free ship
Oct 14
7:56 PM
Online · Buy it now$59.58
incl. $2.99 ship
Oct 14
7:49 PM
Online · Buy it now$69.99
free ship
Oct 14
6:57 PM
Online · Buy it now$55.86
free ship
Oct 14
12:57 AM
Online · Buy it now$61.49
incl. $1.49 ship
Oct 13
10:02 PM
Online · Buy it now$55.58
incl. $2.99 ship
Oct 13
9:51 PM
Online · Buy it now$74.15
incl. $2.15 ship
Oct 13
5:33 PM
Online · Buy it now$72.00
free ship
Oct 13
4:12 PM
Online · Buy it now$70.00
free ship
No graded sales on this card yet. Look them up: every grade, from every grader we read.
See what graded copies sell for
We find a slab of this card on record, then read every grade of it, from PSA, BGS, CGC and more, with their recent sales.
Formats
- StandardLegal
- PioneerLegal
- ModernLegal
- LegacyLegal
- VintageLegal
- PauperNot legal
- CommanderLegal
For every printing of this card, from Scryfall.
Competitive play
Share of top-placing tournament decks that play this card (every printing counts), last 90 days. Bigger events, better finishes and newer decks count more. Constructed: MTGO and Melee results via the MTGO Decklist Cache. cEDH: EDHTop16 with data from TopDeck.gg. Commander: EDHREC. See the meta
| Format | Tier | Decks | Copies | Top 8s | Trend |
|---|---|---|---|---|---|
| Standard | CTech or second-tier decks (3–8%) | 5.3%(138) | 2.7 | 22 | +10.5 pts |
| Commander | BWidely played (2–10%) | 2.5%(30,569) | — | — | — |
| Pioneer | DFringe placements (0.5–3%) | 1.4%(24) | 1.3 | 2 | +4.2 pts |
| Modern | DFringe placements (0.5–3%) | 0.9%(107) | 1.0 | 9 | +1.6 pts |
| cEDH | DFringe placements (0.5–3%) | 0.7%(53) | 1.0 | 19 | +1.4 pts |
| Legacy | FSeen, but rarely (under 0.5%) | 0.1%(2) | 1.5 | 0 | +0.1 pts |
- Game
- Magic: The Gathering
- Set
- Reality Fracture (FRA)
- Number
- 43
- Rarity
- M
- Artist
- Ekaterina Burmak
- Type
- Single
- Released
- Oct 2, 2026
- SubType
- Legendary Planeswalker — Jace
- OracleText
- At the beginning of each opponent's draw step, you draw a card. [+1]: Create a 1/1 blue Illusion creature token. [-2]: For each opponent, return up to one target artifact or creature that player controls to its owner's hand. [-6]: Draw three cards. Then put X +1/+1 counters on each creature you control, where X is the number of cards in your hand.