
Which cards win
Every game's tournament meta, format by format: each card's share of top-placing decks over the last 90 days, tiered S to F, with its fair value from real sales beside it. Refreshed every week.
Magic: The Gathering
8 formats · 54,030 top decks
Most played in Modern
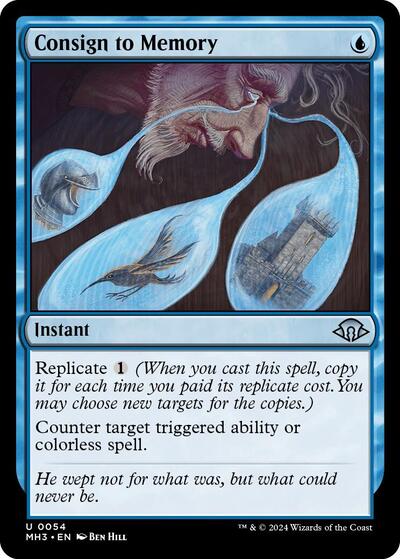
Consign to Memory
51% of top decks · $2.40
- Modern
- cEDH
- Pauper
- Legacy
- Standard
- +3

Pokémon
3 formats · 32,036 top decks
Most played in Standard
Boss's Orders
92% of top decks · $0.39
- Standard
- GLC
- EX era

Star Wars: Unlimited
2 formats · 8,589 top decks
Most played in Premier
Chimaera - A Frightening Reality
46% of top decks · $43.50
- Premier
- Eternal
Yu-Gi-Oh!
10 formats · 6,589 top decks
Most played in Edison
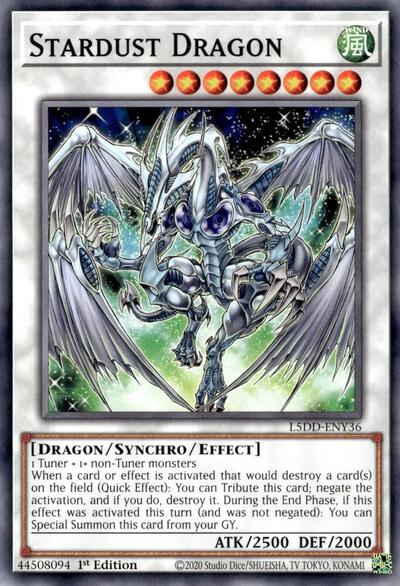
Stardust Dragon
99% of top decks · $0.88
- Edison
- Goat
- Advanced
- HAT
- Tengu
- +5

One Piece Card Game
2 formats · 3,778 top decks
Most played in Standard
Bad Manners Kick Course
18% of top decks · $0.80
- Standard
- Extra Regulation

Riftbound
1 format · 2,065 top decks
Most played in Standard
Chaos Rune
39% of top decks · $0.33
- Standard

Digimon Card Game
1 format · 972 top decks
Most played in Standard
Asuna Shiroki
20% of top decks · $2.63
- Standard

Gundam Card Game
1 format · 223 top decks
Most played in Standard
Overflowing Affection
56% of top decks · $1.55
- Standard
How the tiers are drawn
A card's share is how many of the top-placing decks in the last 90 days ran it, weighted toward bigger events, better finishes and newer results; the trend is that share against the month before. Basic lands and energy are left out.
- Tier S
- In most top decks (40%+)
- Tier A
- Core of top decks (20–40%)
- Tier B
- Played in established decks (8–20%)
- Tier C
- Tech or second-tier decks (3–8%)
- Tier D
- Fringe placements (0.5–3%)
- Tier F
- Seen, but rarely (under 0.5%)