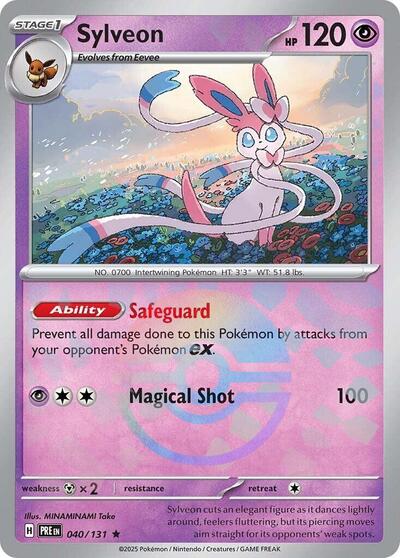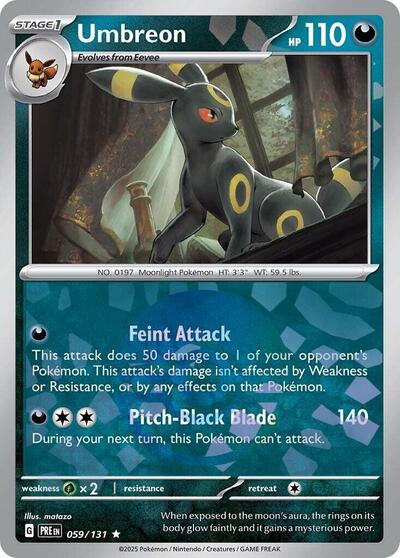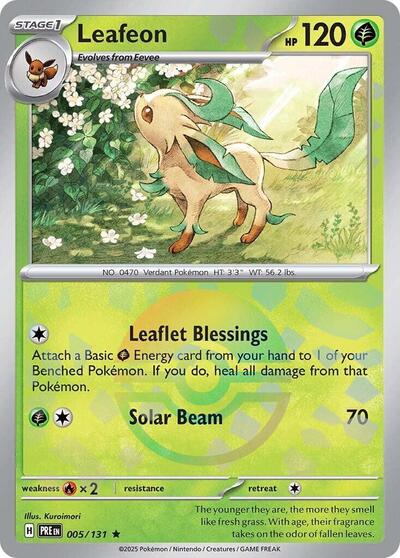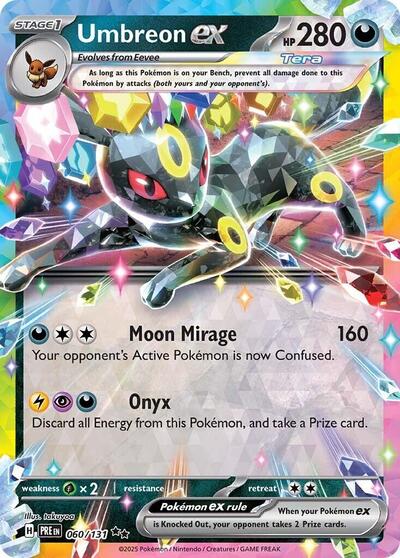
Booster Pack
Prismatic Evolutions Booster Pack
- Market Price
- $13.82
- MSRP
- $4.49*
- Against MSRP
- ▲ 208% vs MSRP

 PRE · Pokémon
347 cards, led by Umbreon ex - 161/131 at $1,102.44.
Released Jan 17, 2025
Set index · PRE
129.87
−1.23 (−0.94%)3M


The 5 most valuable · $219.89 – $1,102.44
A score that started near 100. It rises when its Near Mint English cards sell for more than they did.
Every way SV: Prismatic Evolutions was sold, priced.
26 products
Booster Pack
Display
Display
Booster Bundle Display
Elite Trainer Box
Prismatic Evolutions Elite Trainer Box
$13.39 per pack
Inside
Elite Trainer Box
Elite Trainer Box (Dollar General Exclusive)
$21.95 per pack
Inside
Elite Trainer Box
Pokemon Center Elite Trainer Box (Exclusive)
$35.60 per pack
Inside
Booster Bundle
Prismatic Evolutions Booster Bundle
$13.14 per pack
Inside
Booster Bundle
Booster Bundle + Surprise Box Bundle (Sam's Club)
InsideReported
Premium Collection
Super-Premium Collection
$16.34 per pack
Inside
Collection Box
Accessory Pouch Special Collection
$15.42 per pack
Inside
Collection Box
Binder Collection
$21.39 per pack
Inside
Collection Box
Poster Collection
$13.61 per pack
Inside
Collection Box
Premium Figure Collection
$19.19 per pack
Inside
Collection Box
Surprise Box
$15.82 per pack
Inside
Collection Box
Tech Sticker Collection [Glaceon]
$14.07 per pack
Inside
Collection Box
Tech Sticker Collection [Leafeon]
$12.71 per pack
Inside
Collection Box
Tech Sticker Collection [Sylveon]
$15.35 per pack
Inside
Tin
Mini Tin [Espeon]
$19.03 per pack
Inside
Tin
Mini Tin [Flareon]
$17.21 per pack
Inside
Tin
Mini Tin [Glaceon]
$19.31 per pack
Inside
Tin
Mini Tin [Jolteon]
$16.87 per pack
Inside
Tin
Mini Tin [Leafeon]
$19.32 per pack
Inside
Tin
Mini Tin [Sylveon]
$21.35 per pack
Inside
Tin
Mini Tin [Umbreon]
$20.37 per pack
Inside
Tin
Mini Tin [Vaporeon]
$20.04 per pack
Inside
Blister
2-Pack Blister [Eevee]
$18.09 per pack
Inside
* Standard MSRP for that product type, or a bundle's count × that price.
Open one. Then see how often each hit turns up.
Pack $13.96
Tap the pack. Every card is drawn from the pack's real odds.
10 cards a pack · 4 common · 3 uncommon · 3 hit slots
Common/Uncommon/Rare (Poké Ball pattern)
1 in 3
packs · 33.1%
Double Rare
1 in 6
packs · 16.5%
Ultra Rare
1 in 15
packs · 6.59%
Common/Uncommon/Rare (Master Ball pattern)
1 in 20
packs · 5.11%
ACE SPEC Rare
1 in 26
packs · 3.79%
Special Illustration Rare
1 in 50
packs · 2.00%
Hyper Rare
1 in 170
packs · 0.59%
Chance in one pack · Near Mint

Umbreon ex - 161/131
$1,102.441 in 1,601

Sylveon ex - 156/131
$380.701 in 1,601

Espeon ex - 155/131
$247.451 in 1,601

Leafeon ex - 144/131
$242.271 in 1,601

Glaceon ex - 150/131
$219.891 in 1,601

Vaporeon ex - 149/131
$202.001 in 1,601

Flareon ex - 146/131
$166.421 in 1,601

Jolteon ex - 153/131
$154.241 in 1,601
347 of 347 valued in Near Mint
Umbreon ex - 161/131
Sylveon ex - 156/131
Espeon ex - 155/131
Leafeon ex - 144/131
Glaceon ex - 150/131
Vaporeon ex - 149/131
Flareon ex - 146/131
Jolteon ex - 153/131

Eevee ex - 167/131

Roaring Moon ex

Ceruledge ex

Dragapult ex - 165/131

Raging Bolt ex

Umbreon (Master Ball Pattern)

Iron Valiant ex

Pikachu ex - 179/131

Bloodmoon Ursaluna ex

Gholdengo ex

Palafin ex

Iron Crown ex

Vaporeon (Master Ball Pattern)

Pecharunt ex

Sylveon (Master Ball Pattern)

Terapagos ex - 169/131

Espeon (Master Ball Pattern)
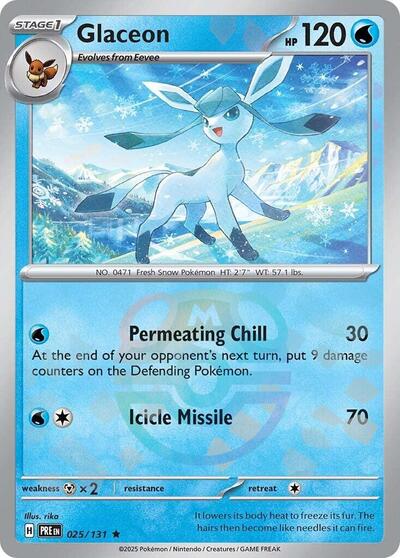
Glaceon (Master Ball Pattern)

Jolteon (Master Ball Pattern)

Leafeon (Master Ball Pattern)

Iron Hands ex - 154/131

Sandy Shocks ex - 159/131

Crispin - 171/131
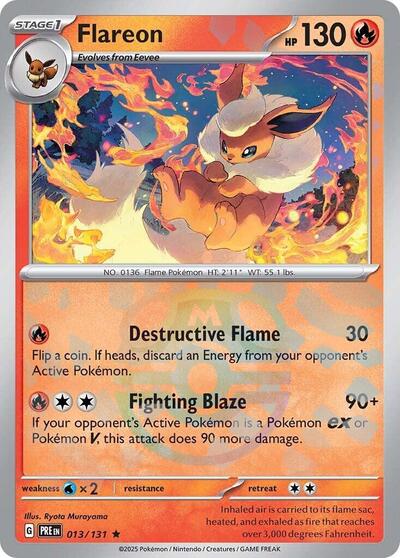
Flareon (Master Ball Pattern)

Lacey - 175/131

Janine's Secret Art - 173/131
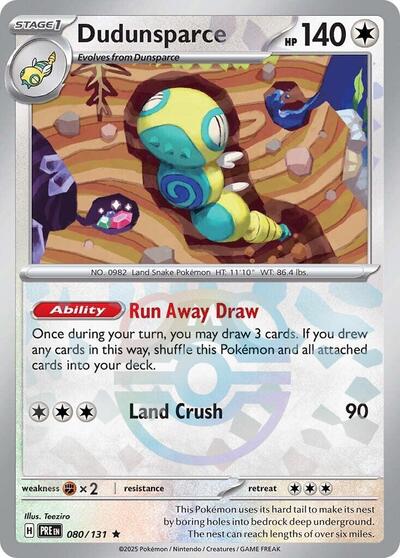
Dudunsparce (Master Ball Pattern)

Wellspring Mask Ogerpon ex - 152/131

Teal Mask Ogerpon ex - 145/131

Hearthflame Mask Ogerpon ex - 148/131

Kieran - 174/131

Cornerstone Mask Ogerpon ex - 160/131
347 singles tracked