Booster Pack
Marvel Super Heroes - Play Pack
- Market Price
- $34.30
- MSRP
- —
Inside
3×Play Booster Pack
- 1×promo card

MSH · Magic: The Gathering
468 cards, led by The Mind Stone (Borderless) at $1,568.17.
Released Jun 26, 2026
Set index · MSH
The index starts once a few weeks of sales collect.


The 5 most valuable · $72.40 – $1,568.17
A score that started near 100. It rises when its Near Mint English cards sell for more than they did.
The index line fills in as weekly prices collect.
Every way Marvel Super Heroes was sold, priced.
18 products
Booster Pack
Inside
Display
Collector Booster Display
$38.65 per pack
Inside
Display
Jumpstart Booster Display
$4.32 per pack
Inside
Display
Play Booster Display
$3.45 per pack
Inside
Booster Bundle
Bundle
$4.37 per pack
Inside
Booster Bundle
Gift Bundle
$7.01 per pack
Inside
Collection Box
Beginner Box
Inside
Collection Box
Quick Play Collection Box
InsideReported
Collection Box
Scene Box - Heroes United
$6.47 per pack
Inside
Collection Box
Scene Box - Villains Unleashed
$5.84 per pack
Inside
Prerelease Kit
Prerelease Pack
$3.88 per pack
Inside
Booster Pack
Collector Booster Omega Pack
Booster Pack
Collector Booster Pack
Booster Pack
Collector Booster Pack (Minimal Packaging)
Booster Pack
Jumpstart Booster 2-Pack
Booster Pack
Jumpstart Booster Pack
Booster Pack
Play Booster Pack
Other
Draft Night
$6.67 per pack
Inside
* Standard MSRP for that product type, or a bundle's count × that price.
Open one. Then see how often each hit turns up.
Pack $41.92
Tap the pack. Every card is drawn from the pack's real odds.
15 cards a pack · 3 traditional foil common cards · 2 traditional foil uncommon cards · 1 traditional foil common or uncommon scene card · 1 traditional foil city calm or city chaos basic land · 8 hit slots
U (Traditional foil scene card)
1 in 1
packs · 80.0%
T (traditional foil double-sided token)
1 in 2
packs · 64.0%
L (traditional foil city calm basic land)
1 in 2
packs · 50.0%
L (traditional foil city chaos basic land)
1 in 2
packs · 50.0%
R
1 in 2
packs · 45.0%
R (traditional foil extended-art card from the main set)
1 in 3
packs · 31.8%
R (extended-art card from the main set)
1 in 4
packs · 27.8%
C (Traditional foil scene card)
1 in 5
packs · 20.0%
R (traditional foil logo card)
1 in 6
packs · 17.2%
R (logo card)
1 in 7
packs · 15.1%
R (traditional foil panel card)
1 in 7
packs · 13.9%
R (panel card)
1 in 8
packs · 12.1%
M (traditional foil classic comic card)
1 in 10
packs · 9.90%
M
1 in 11
packs · 9.40%
R (traditional foil scene card)
1 in 14
packs · 7.30%
R (traditional foil borderless land card)
1 in 15
packs · 6.60%
R (scene card)
1 in 16
packs · 6.40%
R (borderless land)
1 in 17
packs · 5.80%
M (scene card)
1 in 20
packs · 4.90%
M (logo card)
1 in 22
packs · 4.60%
M (traditional foil scene card)
1 in 25
packs · 4.00%
M (traditional foil logo card)
1 in 28
packs · 3.60%
M (traditional foil panel card)
1 in 33
packs · 3.00%
M (traditional foil extended-art card from the main set)
1 in 37
packs · 2.70%
M (panel card)
1 in 38
packs · 2.60%
M (extended-art card from the main set)
1 in 43
packs · 2.30%
Chance in one pack · Near Mint
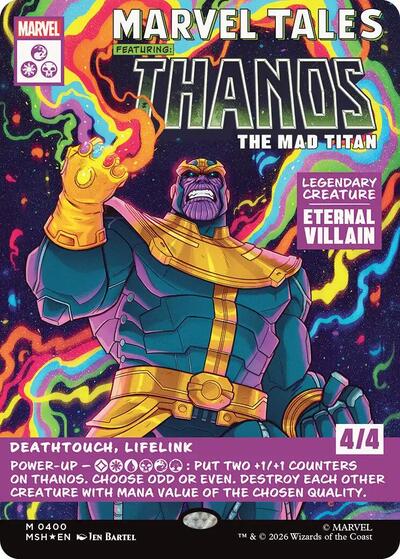
Thanos, The Mad Titan (Borderless) (0400)
$153.731 in 152
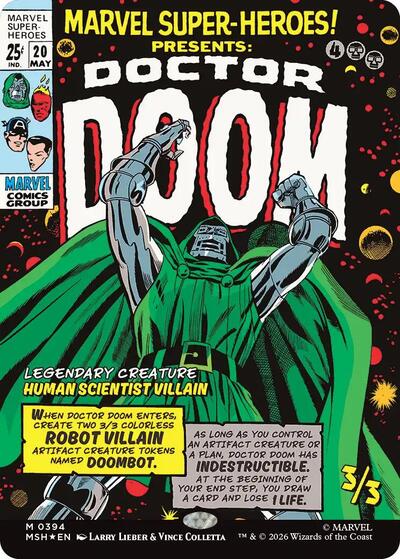
Doctor Doom (Borderless) (0394)
$148.631 in 152
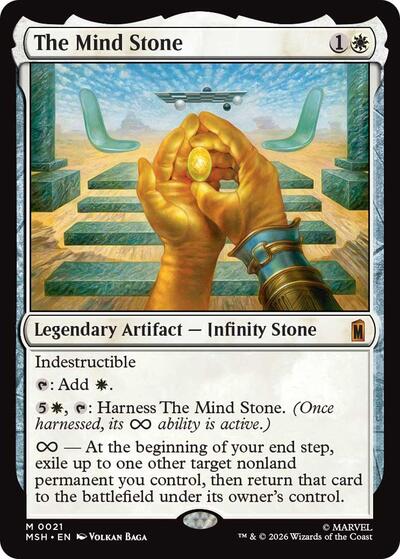
The Mind Stone
$82.851 in 266
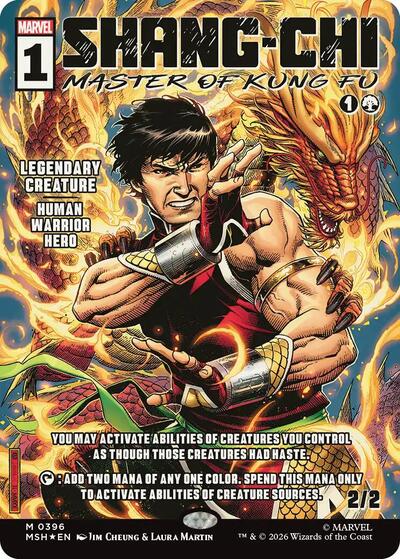
Shang-Chi, Master of Kung Fu (Borderless) (0396)
$73.411 in 152
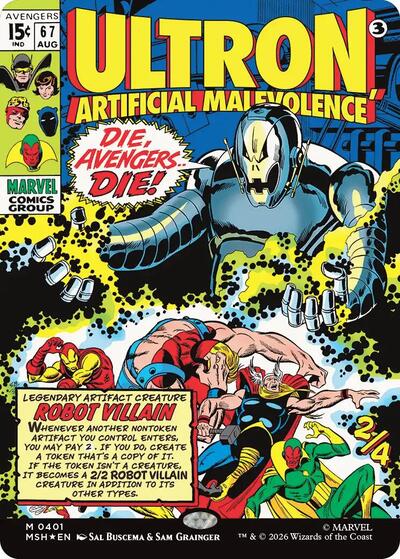
Ultron, Artificial Malevolence (Borderless) (0401)
$72.401 in 152
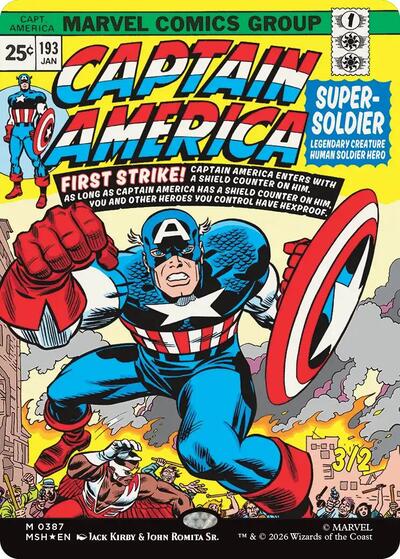
Captain America, Super-Soldier (Borderless) (0387)
$53.791 in 152
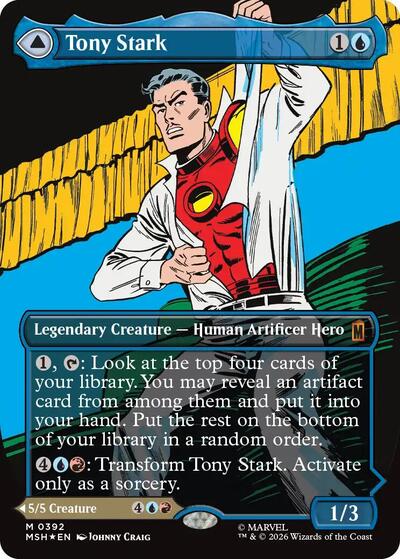
Tony Stark (Borderless) (0392)
$53.621 in 152
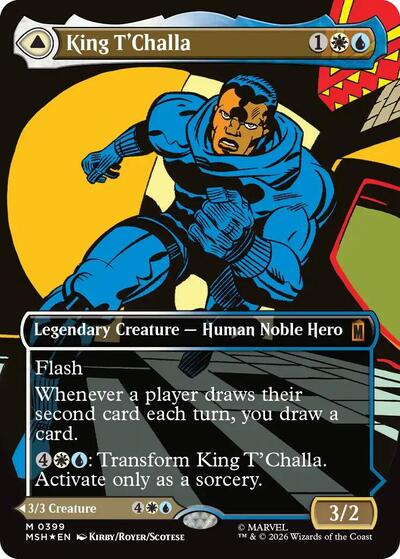
King T'Challa (Borderless) (0399)
$44.361 in 152
468 of 469 valued in Near Mint
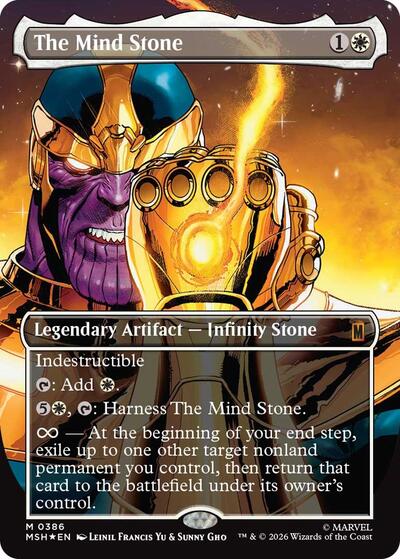
The Mind Stone (Borderless)
Thanos, The Mad Titan (Borderless) (0400)
Doctor Doom (Borderless) (0394)
Shang-Chi, Master of Kung Fu (Borderless) (0396)
Ultron, Artificial Malevolence (Borderless) (0401)
Captain America, Super-Soldier (Borderless) (0387)
Tony Stark (Borderless) (0392)
The Mind Stone
King T'Challa (Borderless) (0399)
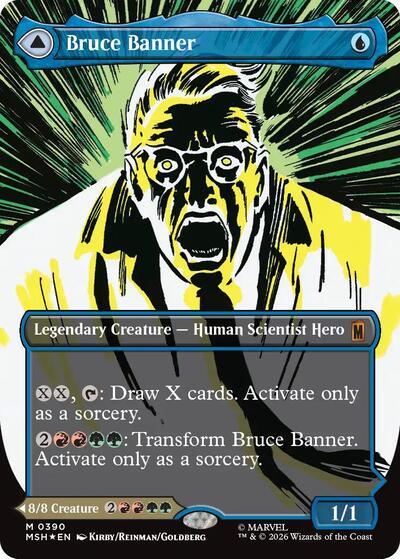
Bruce Banner (Borderless) (0390)
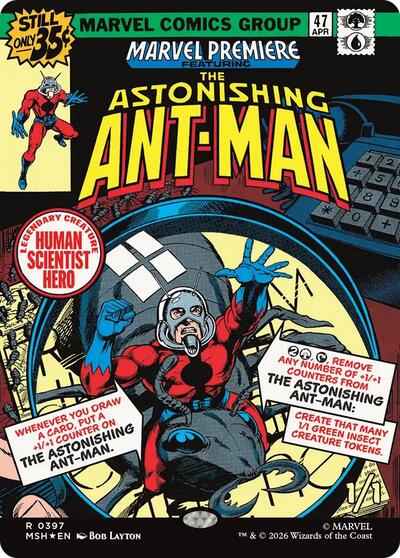
The Astonishing Ant-Man (Borderless)
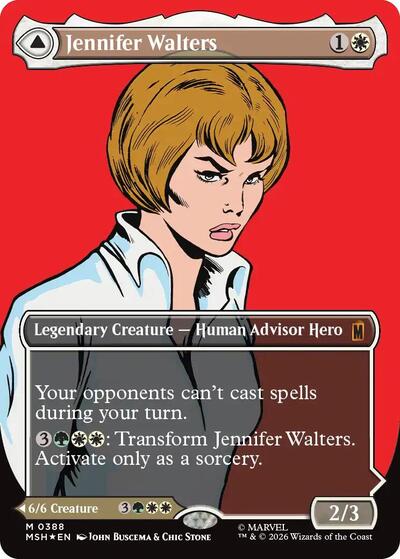
Jennifer Walters (Borderless) (0388)
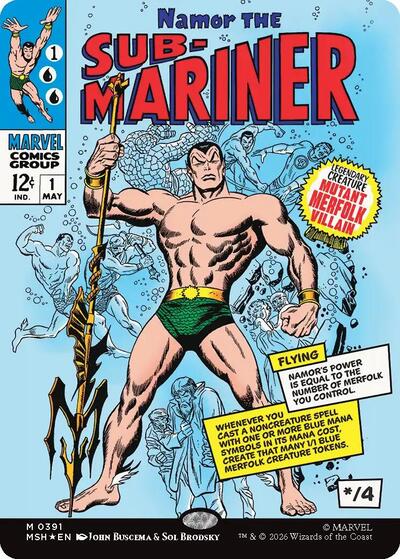
Namor the Sub-Mariner (Borderless) (0391)
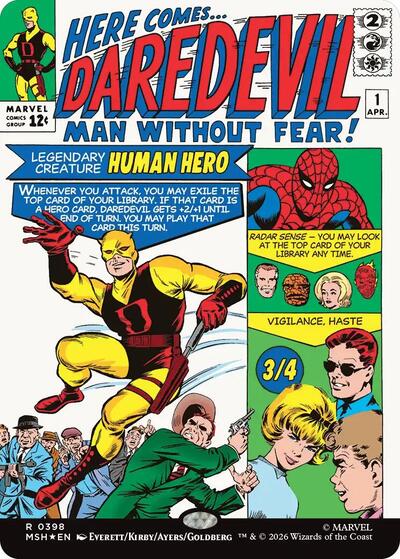
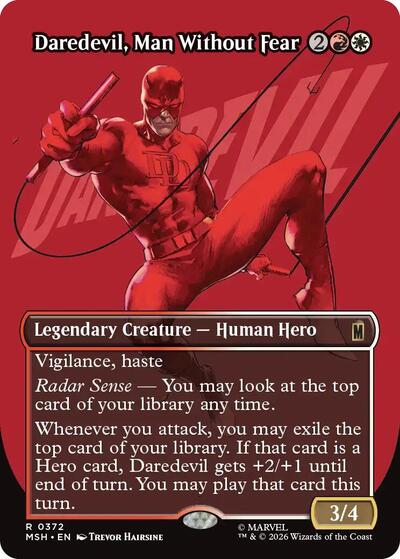
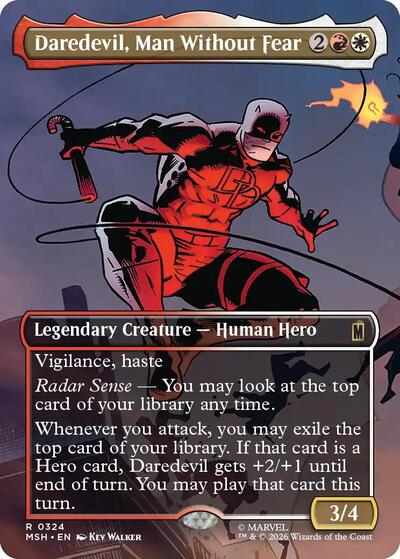
Daredevil, Man Without Fear (Borderless) (0398)
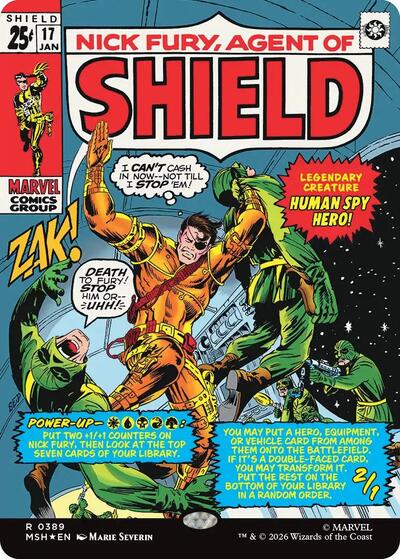
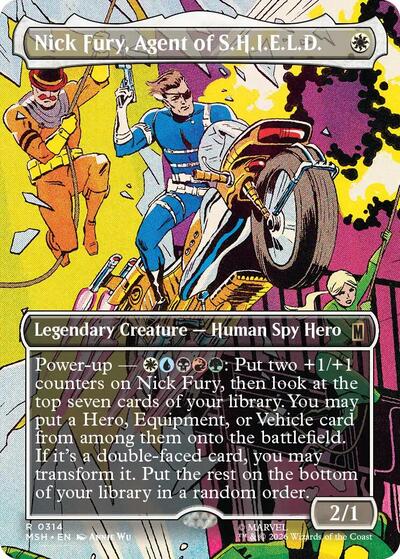
Nick Fury, Agent of S.H.I.E.L.D. (Borderless) (0389)
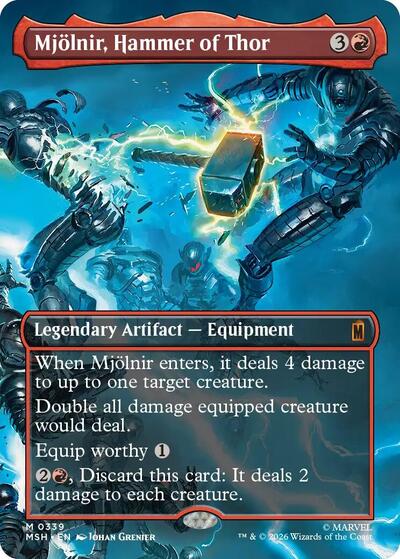
Mjolnir, Hammer of Thor (Borderless) (0339)
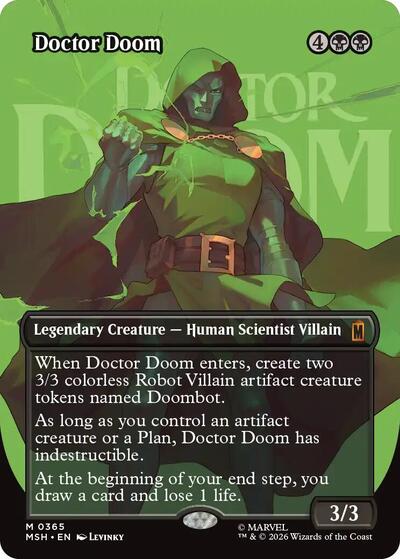
Doctor Doom (Borderless) (0365)
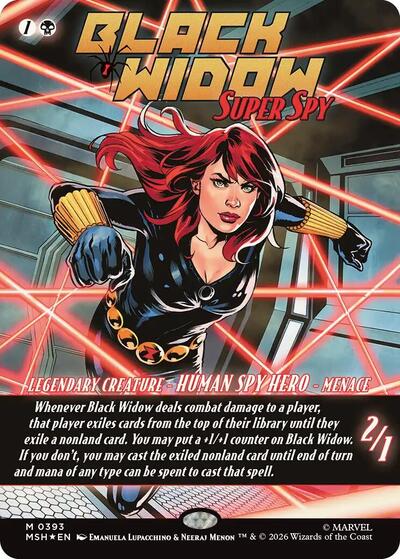
Black Widow, Super Spy (Borderless) (0393)
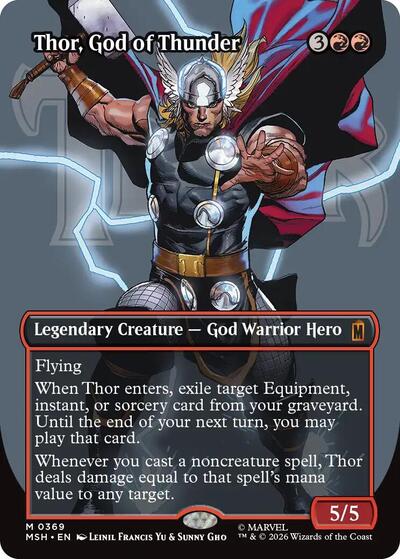
Thor, God of Thunder (Borderless) (0369)
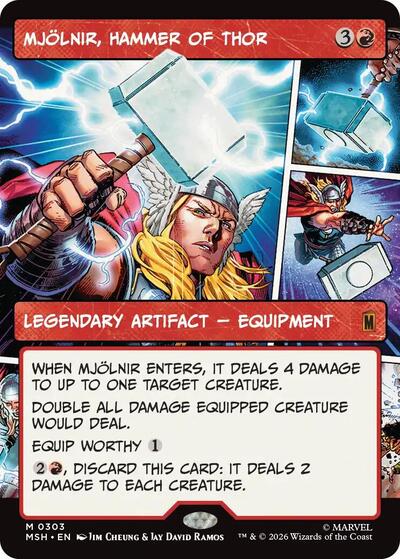
Mjolnir, Hammer of Thor (Borderless) (0303)
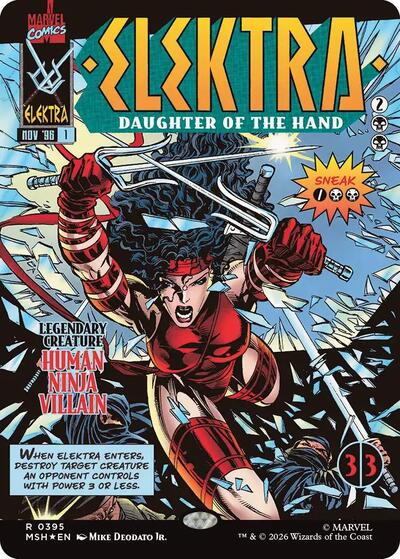
Elektra, Daughter of the Hand (Borderless) (0395)
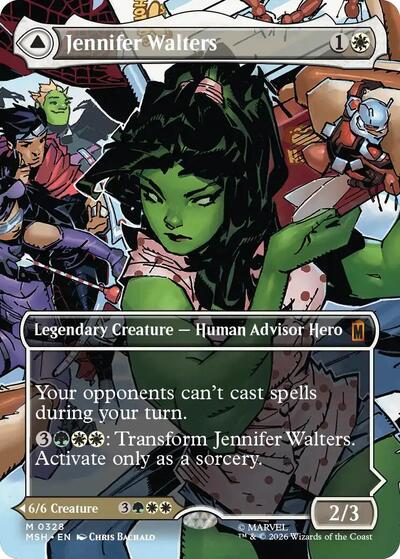
Jennifer Walters (Borderless) (0328)
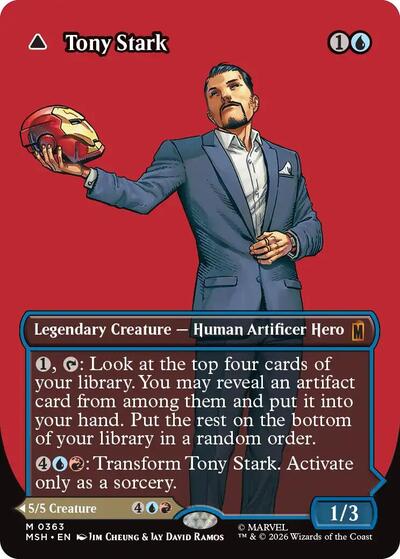
Tony Stark (Borderless) (0363)
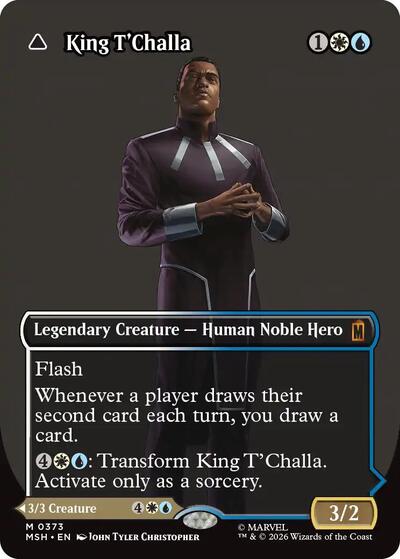
King T'Challa (Borderless) (0373)
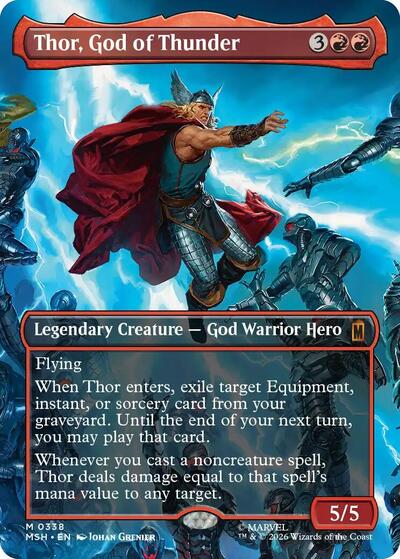
Thor, God of Thunder (Borderless) (0338)
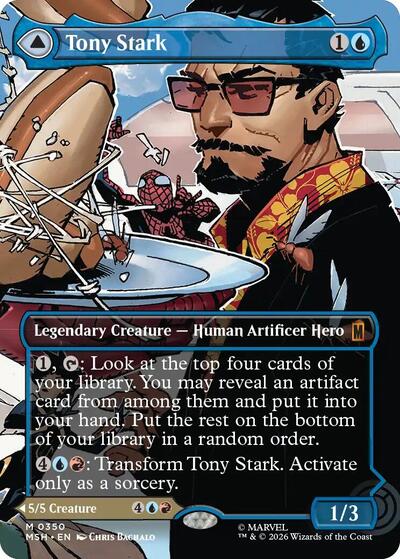
Tony Stark (Borderless) (0350)

Cosmic Cube (Borderless) (0312)
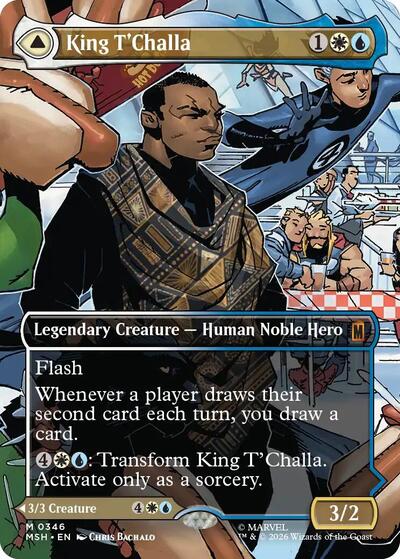
King T'Challa (Borderless) (0346)
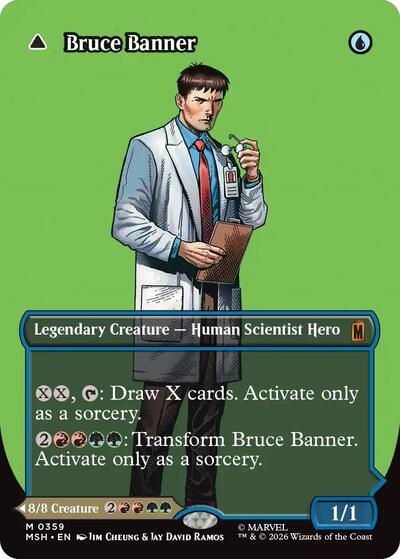
Bruce Banner (Borderless) (0359)

Jennifer Walters (Borderless) (0355)
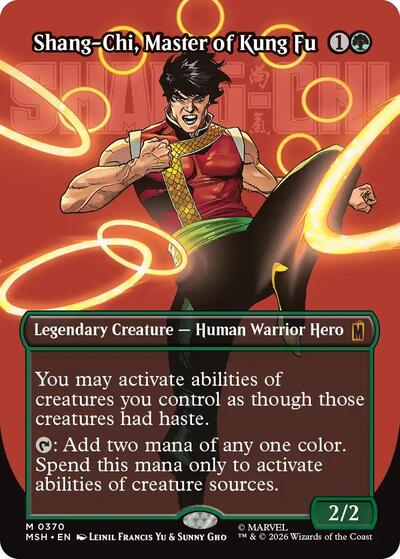
Shang-Chi, Master of Kung Fu (Borderless) (0370)
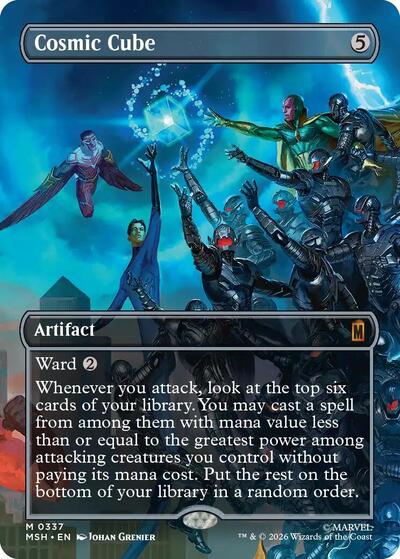
Cosmic Cube (Borderless) (0337)
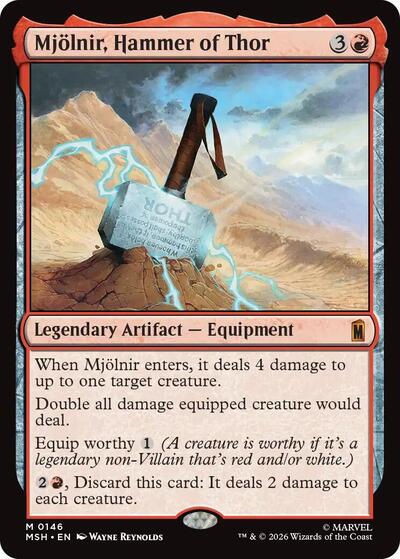
Mjolnir, Hammer of Thor
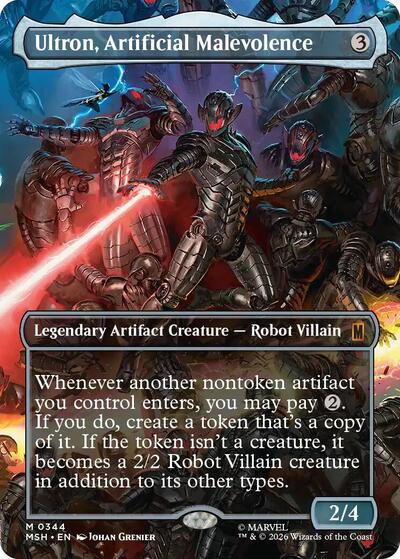
Ultron, Artificial Malevolence (Borderless) (0344)
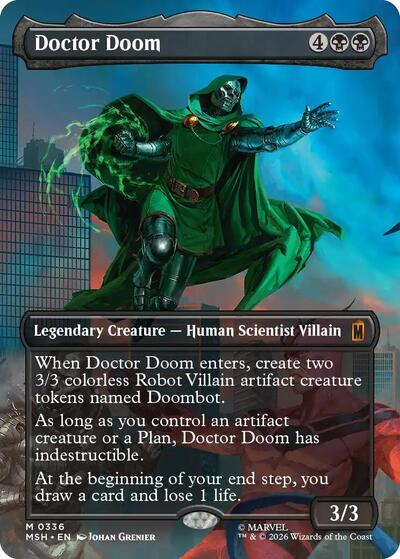
Doctor Doom (Borderless) (0336)
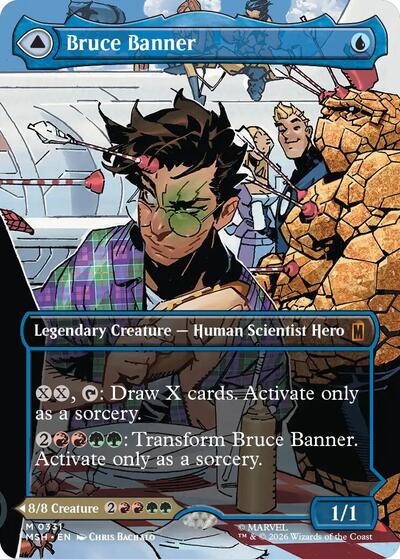
Bruce Banner (Borderless) (0331)
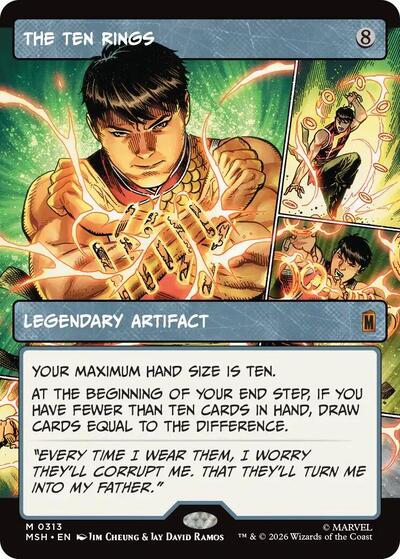
The Ten Rings (Borderless)
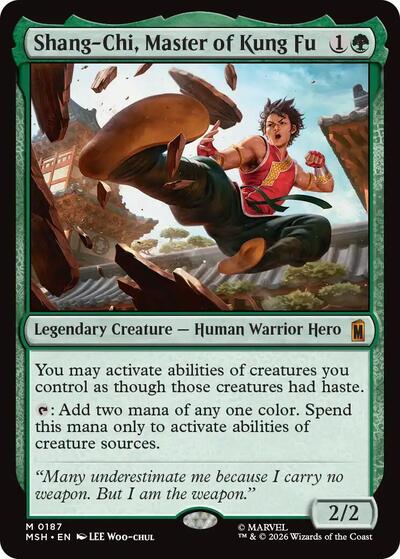
Shang-Chi, Master of Kung Fu
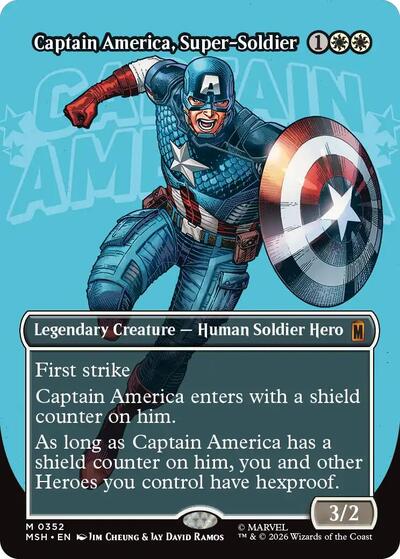
Captain America, Super-Soldier (Borderless) (0352)
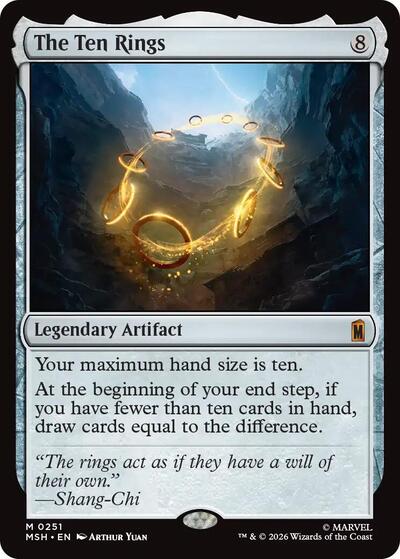
The Ten Rings
469 singles tracked